Graded Categorisation for Knowledge Management Systems
Abstract
Knowledge Management Systems are becoming ubiquitous in organisations both large and small. Many knowledge workers find themselves using tools such as experience management or lessons learned systems on a daily basis. In many cases, these kinds of systems represent a break with the traditional electronic library format for information retrieval. Entries into these systems are not vetted and guarded by an expert gatekeeper, highly trained in information management. Instead, the entries are made by the domain experts and day-to-day users, and the responsibility for indexing and categorising the data falls on their shoulders. However, since the domain expert is making the entry into the system, it makes sense to utilise their knowledge and expertise in categorising the knowledge artefact. This presents the challenge of designing user interfaces to support categorisation.
This paper investigates the use of a graded-category structure in categorisation tasks. An experiment was carried out comparing two different user-interfaces for categorisation: one allowing graded membership of categories, the other allowing only exclusive (completely in or completely out) membership. The level of consensus amongst participants and time taken to categorise was compared between the two interfaces in order to determine if an interface allowing graded category membership better supports cognitive processes involved in categorising knowledge artefacts.
Keywords
Categorisation, graded membership, fuzzy logic, knowledge management
1. Introduction
Although opinions vary widely about how best to go about knowledge management (or indeed, whether or not it is even possible to manage knowledge), very few would disagree that “knowledge is the only sustainable way for organisations to create value and profitability” [1]. In recognition of this, the last decade has seen a plethora of software systems installed in organisations under the banner of knowledge management (KM). Lessons learned systems, experience management systems, knowledge-bases, social software, groupware, wikis, to mention just a few, have all claimed to aid knowledge management in one way or another. Workers in all kinds of industries from manufacturing to law now find themselves using some form of Knowledge Management System (KMS).
The motivation for this study came from the observation of one such KMS implemented in an automotive manufacturing plant (described in Cardew-Hall et al [2] and Smith et al, [3]). Using this system shop-floor workers were able to enter descriptions of common problems they encountered and steps that could be taken to prevent or fix the problem. The workers were highly skilled and experienced in their field, and so could provide a wealth of knowledge about the issues they were describing. None of them, however, were information retrieval professionals. Many did not need to use a computer at all in their day-to-day tasks and some even required training in using a mouse and graphical user interface. They were not highly experienced in organising information for electronic retrieval, nor did they need to be—their daily tasks simply did not call for it.
The designers of this particular system worked hard at crafting the system to meet the needs of the users and developed an innovative method for the incorporation of digital photographs [2]. This allowed users to take a photo of a defective part, for example, and draw a big red circle on the computer screen, highlighting the defect. Other users could then see the problem at a glance, rather than trying to interpret a complicated textual description.
This raised issues of how best to organise the data. Images are notoriously difficult to categorise automatically, so categorisation information needed to be entered by the user. But what categories would best suit the needs of people searching the system for useful information? Most problems related to a specific part being produced, so it might make sense to allow users to search by part. Some problems, however, relate to machinery or processes, not to a particular part but these entries still need to be accommodated by the system. It would also seem useful to allow users to search for solutions to a particular type of problem such as “All problems with surface finish related to part XYZ.” But what happens when a user encounters a problem that has never been seen before? Should the user be allowed to create a new category? Or must all entries fit into a fixed hierarchy? If they are allowed to create a new category, then terminology problems may occur. What one person calls a “scorch mark,” another may call a “surface defect.” Should there be a “miscellaneous” category to allow categorisation of unusual or one-off problems? What happens if operators begin entering everything under “miscellaneous” since they don’t have the time to spend looking through a list of categories for the particular one that applies to their situation?
These kinds of question occur regularly in the KM literature:
In order to make [a knowledge artefact] useful, I have to do the work of knowing about the database, accessing it, and making the connection between my situation and the situation being narrated, using a category system provided by the designer which may have no relation to my way of categorising the problem. (Anyone who has attempted to use a manual to diagnose and fix a technical problem will be aware of this problem of categorisation of problems; all serious technical writers break their hearts over it). [4]
Some of these issues perhaps, could be avoided if an information management professional were employed to maintain and administer the system. Entries could be edited and sorted by this experienced expert, and category systems tweaked and adjusted to best suit the needs of the organisation. Other issues mentioned above however, will not be resolved, even if an experienced professional is doing the categorisation. Categorisation remains a subjective process, since it is being performed by a human being, as Anderson and Pérez-Carballo [5] write: “[V]ariability [in categorisation] appears to be due to those subjective, cognitive, ‘mentalist’ processes going on in our minds, and the fact that the mind of every individual is different.” Even if an information management expert could resolve all issues relating to categorisation, not all organisations can afford such an expense.
In the absence of an information management expert, the responsibility for categorising the knowledge artefact falls to the user making the entry. This makes sense, since the person who is likely to know the most about that particular entry is the person who entered it. They are the domain expert. This raises the challenge of how best to design user interfaces for categorisation to support the domain expert. Hence this study begins an exploration into categorisation processes used for knowledge management.
1.1 Graded Categories
Categorisation is an area which has been widely studied in the area of cognitive psychology and social psychology [6]. Lakoff [7], Barsalou [8] and others assert that categorisation in the human mind is not a matter of something being completely in a category or completely out of it. Rather, an item may belong to a category by degrees. A sparrow may be a better example of a bird than an emu. Some may call Beethoven’s 9th Symphony a better example of music than Britney Spears’ Hit Me Baby One More Time.
Categorisation in the information retrieval domain however, does not in general reflect this graded structure. Most categorisation schemes seem to be modelled on the metaphor of a well-organised library. A knowledge artefact corresponds to a book, and categories correspond to shelves. Because a book can only have one physical location, the librarian must make a decision as to what the book is about, and place it on the correct shelf accordingly. Yet, in the digital realm, information does not necessarily have to be organised in this way. As Shirky [9] writes, “There is no shelf.”
The experiment described in this paper is a preliminary investigation into the usefulness of graded categorisations, and how user interfaces can be designed to support them.
2. Method
The aim of the experiment was to compare two different interfaces for categorisation. One allowed users to indicate only that an artefact did or did not belong to a category using standard radio buttons (referred to as the non-graded interface (NGI)). The other allowed users to give an indication of how much an artefact belonged to a particular category using a slider-bar interface (referred to as the graded interface (GI)).
The experiment involved participants playing a categorisation game in groups of 4–8 players. In the game, participants were shown a knowledge artefact (such as an academic abstract or video clip), and asked to categorise it using one of the two interfaces described above. After categorising the item, participants’ answers were compared to others in the group. For each artefact categorised, participants were given a score based on how close their categorisation matched the group mean.
The format of a game was chosen to encourage active participation. The competitive nature of a game gave participants an incentive to think carefully about their categorisation choices—to think “how would others categorise this?” This is a very similar process to thinking “how would someone else haves categorised the information I am looking for?”
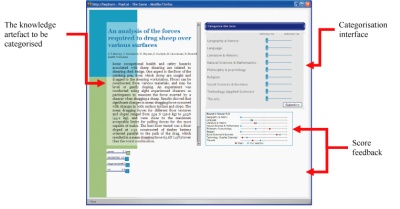
Figure 1. The user interface for the categorisation game.
The game was played in ten rounds, one for each knowledge artefact. Each participant in a group was presented with a knowledge artefact to be categorised (as shown in Figure 1) and asked to categorise it using one of the interfaces shown in Figure 2. Each participant in a group used the same interface. Interfaces were varied between groups. After all participants in a group had submitted their categorisation choices, a score was calculated for each participant based on how closely their answers matched the group mean. This score was displayed to the user along with the next item to be categorised.
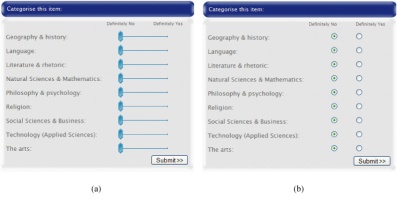
Figure 2. The two categorisation interfaces: (a) The graded interface (GI); (b) the non-graded inteterface (NGI).
For each artefact categorised, nine variables were returned giving the degree to which the artefact belonged to each category. For the NGI these variables could only take on the values zero or one, corresponding to “Definitely No” or “Definitely Yes” as shown in Figure 2. For the GI these variables could take any value between zero and one, with a resolution of 0.01. These variables were used to measure the degree of agreement amongst players, as described in Section 3.1.
2.1 Category Selection
The categories used in the game were nine of the ten top-level categories specified by the Dewey Decimal system as shown in Figure 2. The first category of the Dewey Decimal System, Generalities, was excluded on the basis that it may serve as a kind of “Other” category into which any of the artefacts might reasonably be placed. The participants were not told that the categories were taken from the Dewey Decimal system, and it is unlikely that many of the participants would be intimately familiar with which subcategories were excluded by removing the Generalities category.
2.2 Participant demographics
Participants were recruited from students enrolled in a first-year engineering class offered by the Department of Engineering at the Australian National University. Of the 126 participants who took part in the experiment, 61 used the NGI, while 65 used the GI. Table 1 summarises other characteristics of the participants.
| Female | Male | Total | |
|---|---|---|---|
| Non-English First Language | 3 | 30 | 33 |
| English First Language | 14 | 79 | 93 |
| Total | 17 | 109 | 126 |
2.3 Selection of knowledge artefacts
Artefacts were selected to cover a broad range of subject areas and different media types. They included academic abstracts, comic strips, television advertisements, and a poem. Academic abstracts formed the majority of the artefacts to be categorised. They were selected as documents typical of the type of in-depth information that might be categorised in a KMS. An abstract is intended to summarise the entire paper and give the reader enough information to know what it is about. Comic strips are of particular interest for a number of reasons:
- They are normally stored in a raster image format (eg. bitmap, JPEG, or GIF) which means that although they may contain textual data, it is not usually in a form easily readable by a machine.
- Although a comic strip may contain textual information, other graphical elements are usually essential to understanding the comic.
- Many comics (such as the ones selected for this study) are intended to be humorous, and will often be classified in a ‘humour’ category, yet the topics covered by a comic strip may include anything from business to politics, to family life to zoo-keeping.
| Media Type | Number of Artefacts |
|---|---|
| Academic abstract | 5 |
| Comic strip | 2 |
| Television advertisement | 2 |
| Poem | 1 |
| Total | 10 |
Television advertisements were included as another form of media that may be found in a knowledge management system. They were also selected to be interesting in order to help keep participants active and interested in the game. The poem artefact was a sonnet by Shakespeare, and was included as an example of an item that may be outside of an Engineering student’s specific domain of expertise.
3. Results
Two main variables were recorded during the experiment: 1) The degree of membership assigned to the item for each category, and 2) the time taken to categorise each item.
3.1 Categorisation results
Of particular interest for this experiment was the degree to which users of different interfaces agreed with one another in their categorisation choices. To measure this, an aggregate distance from mean score was calculated for each participant. The calculation of this score is probably best described by an example.
For a single artefact, the mean degree of membership is calculated for each category. The distance from mean for a particular player is the geometric distance between their degree of membership values, and the mean of all players. If there were only two categories (instead of the nine used in the experiment), it could be plotted as in Figure 3.
Hence, the equation for calculating an individual distance from the mean is shown in Equation 1:
where di,j,k is the degree of membership of artefact j for category k assigned by player i, and d̄i,j,k is the mean degree of membership assigned to artefact j for category k across all participants using the same interface.
To produce a single score for each player, these scores were aggregated across all ten artefacts, as in Equation 2:
where Xi is the aggregate distance from mean for participant i, and xi,j is the distance from mean for artefact j and participant i.
The distance from mean for the NGI and GI are shown in Figure 4. The results showed that the distance from mean was much lower for the GI, indicating that graded categorisation does indeed reflect a cognitive process. If humans categorised only in exclusive categories (as with the NGI), then use of the GI would not make sense to participants. Participants using the GI did not only select values of “Definitely Yes” or “Definitely No”, but chose values in- between to represent a partial degree of membership, hence they were more accurately able to predict a mean value.
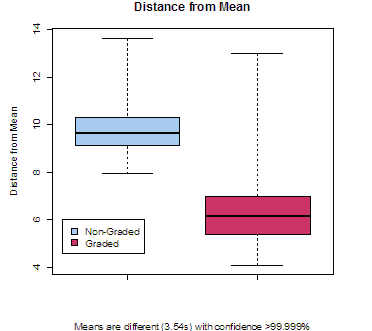
Aside from the difference in interface, factors such as gender, first language and age did not seem to significantly affect the distance from the mean.
On the whole, there is a general consensus as to the degree to which artefacts belong to which categories. This can be seen in the Appendix, which shows the mean degree of membership assigned to each artefact. There is a high degree of correlation (0.964) between results from the graded interface and results from the non-graded interface-where an artefact has a high mean value for the NGI, there is usually a comparatively high value for the GI also. This suggests firstly, that the interface did not have a significant impact on what categories an artefact belonged to. Secondly, the lower distance from mean indicates that a GI may converge to a relatively stable mean value more quickly than a NGI.
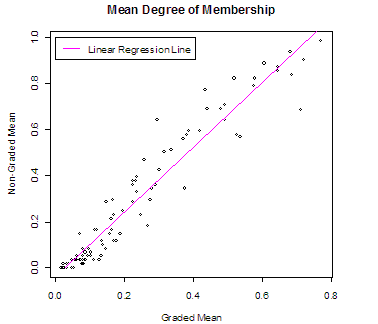
It will be noted from Figure 5 that there is a cluster of points around the zero values on both axes. One factor that may account for this is that both interfaces were set to default to “Definitely No”, corresponding to a zero degree of membership. Secondly, it can be seen from the Appendix that artefacts tended to have only three or four categories each that received larger degrees of membership, while the rest had membership values close to zero.
Another point to note from the Appendix and Figure 5 is that there is a lot more variation in the categorisation values away from the zero point. This, and the cluster of points around the zero point suggests that participants were much more confident at suggesting an artefact did not belong to a category than they were at suggesting an artefact did belong to a category.
3.2 Time taken to categorise
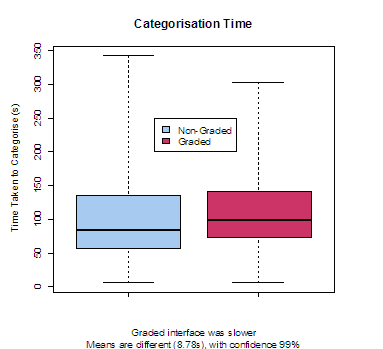
The game system recorded time taken from when the artefact was first displayed until the user clicked the “Submit” button. Thus, the recorded time was a measure of the time taken to read or view the artefact as well as the time taken to categorise the item. This does not allow a true measurement of how long the user took to categorise an artefact, however, it does allow comparison between the two interfaces since the artefacts were identical regardless of which interface was used.
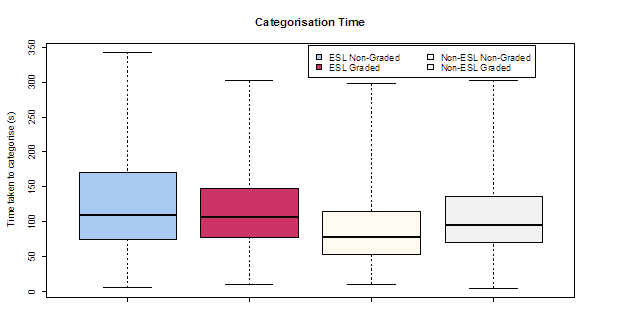
The time taken to categorise with the NGI was consistently less than with the GI (Figure 6). The difference in means was statistically significant with confidence 99%. There was no significant difference in mean time to categorise between males and females, however, having English as a second language did have a significant effect on time taken to categorise. Not surprisingly, those who had English as their first language and used the non-graded interface performed the fastest, as shown in Figure 7. Furthermore, English as second language (ESL) had a much greater impact on categorisation time than interface. This may be due to difficulties in comprehending the artefacts for ESL participants who may not be as fluent in English as others. Thus, while there is a clear difference in categorisation time for non-ESL participants across interfaces (99.99% confidence), there was no significant difference for ESL participants. This would suggest that as the time taken to comprehend the artefact increases with language difficulties, the difference in time due to the interface becomes insignificant.
No significant difference in time taken to categorise was observed between males and females.
4. Expanding the Study
As an exploratory study, this experiment showed some interesting results. There is much room for further expansion however:
- The experiment was only conducted with first-year engineering students from a single university. Females in particular, were under-represented in the group. A further study with a broader demographic range would be useful to address this.
- Only a relatively small number of artefacts were categorised due to time constraints. A study with a larger number of artefacts may allow more conclusions to be drawn regarding the effect of different media types on categorisation.
- It is also very difficult (perhaps even impossible) to separate comprehension time from categorisation. A study which uses only very simple artefacts for categorisation (such as pictorial symbols) may give more accurate timing information as the time taken to comprehend the artefact is minimised.
- Using the Dewey Decimal top-level categories may not have been the most suitable category system to choose, as the Dewey Decimal system was primarily devised as a classification system for shelving books. Developing a number of categories more suited to the artefacts to be categorised may provide clearer results.
5. Conclusion
A comparative study of this kind raises the obvious question: Is one interface better than the other for categorising? This is a difficult question to answer, since there is no objective standard by which we can say “participants who used this interface produced more correct categorisations than other participants.” Categorisation in this context is a subjective exercise. Yet the results show that categorisations are not arbitrary either—participants tended to agree, at least to some degree on which categories an artefact belonged to. This was regardless of the interface used.
The NGI did prove faster, which may be important in a lot of applications where use of a KM system is seen as secondary to an employee’s core tasks. On the other hand, the GI (by its very nature) produces much less variation in results. In some cases, where only one person is categorising artefacts, a graded categorisation measure could be used to approximate a degree of membership based on categorisations from many people.
Much, of course, depends on the information retrieval methods that the categorisations are being provided for. If the artefact being categorised must reside in one physical location (like a book on a shelf), then multiple categorisations as used in this system are not suitable. If, however, the retrieval system uses a search algorithm that calculates relevance scores, then graded, multiple categorisations may be extremely useful.
Bibliography
Mac Morrow, M., 2001. Knowledge Management: An Introduction, Annual Review of Information Science and Technology (ARIST) 35.
Cardew-Hall, M.J., Smith, J.I., Pantano, V., Hodgson, P.D., 2002, Knowledge capture and feedback system for design and manufacture, SAE International Body Engineering Conference - IBEC 2002, July 9–11 2002, Paris, France.
Smith, J., Cardew-Hall, M.J., Pantano, V., Hodgson, P., 2004, Design, implementation and use of a knowledge acquisition tool for sheet metal forming, 24th ASME Computers In Engineering Conference, Salt Lake City, USA, Sept 2004.
Linde, C., 2001. Narrative and social tacit knowledge, Journal of Knowledge Management 5(2), 160–170.
Anderson, J. D., Pérez-Carballo, J., 2001. The nature of indexing: how humans and machines analyze messages and texts for retrieval. part I: Research, and the nature of human indexing, Information Processing and Management 37(2), 231–254.
McGarty, C., 1999. Categorization in social psychology, SAGE Publications, London.
Lakoff, G., 1987. Women, Fire, and Dangerous Things, The University of Chicago Press, Chicago and London.
Barsalou, L. W., 1985. Ideals, central tendency, and frequency of instantiation as determinants of graded structure in categories, Journal of Experimental Psychology: Learning, Memory, and Cognition 11(4), 629–654.
Shirky, C., 2005. Ontology is Overrated: Categories, Links, and Tags, http://shirky.com/writings/ontology_overrated.html, Accessed 30/06/2005